| Pressure Altitude - A Guide for Climbers * |
|
It is common knowledge that atmospheric pressure decreases with rising altitude. However changes in temperature and latitude also alter air pressure in a predictable manner. These latter relationships are described here.
As an example of the underlying principles, the air pressure at Mount McKinley is compared with that found on other high mountains at temperate latitudes.
This note is an easily readable version of the original article containing a detailed account of the calculational methodology.
The International Standard Atmosphere defines what consitutes a "normal" atmosphere. The sea level pressure is defined as 1.01325 bar (29.92 inches of mercury); the sea level temperature is defined as 15° C (59° F); and the temperature decreases at a lapse rate of 6.5° C / km (3.57° F / 1,000 feet).
True altitude corresponds to the normal sense of what we think of as elevation above sea level.
Pressure altitude is that altitude in the Standard Atmosphere which corresponds to the observed air pressure. When the barometer is reading low, the pressure altitude is higher than the true altitude - and conversely when reading higher than normal. Thus a true altitude of 10,000 feet on a low pressure day may mean a pressure altitude of 10,200 feet.
Atmospheric pressure forces air into the lungs. Hence in mountaineering pressure altitude is the key quantity of interest.
 |
(1a) |
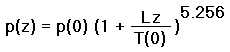
Here p(0) is the sea level pressure, and p(z) is the pressure at true altitude z. T(0) is the sea level temperature as measured in degrees Kelvin or Rankine from absolute zero. T(0) is determined by extrapolating observed temperature readings to sea level using the standard lapse rate L, of 6.5° C / km (3.57° F / 1,000 feet).
Equation (1a) shows how pressure declines with rising true altitude. There is a halving of pressure with roughly every 5,500 meters (18,000 feet) of altitude. Thus at 11,000 meters (36,000 feet) the pressure is one-fourth that at sea level as the square of one-half.
We also have
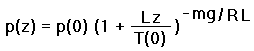 |
(1b) |
Here the constant 5.256 is shown to be the quotient -mg/RL, where g is the acceleration due to gravity, and the other constants are defined in the original article.
Consider the effect of temperature upon pressure altitude. At lower temperature the entire air column is compressed, corresponding to the observation that colder air is denser. Thus a given isosurface (surface of equal pressure) will lie at a lower true altitude in a cold environment compared to a warmer one. In a hot environment the converse occurs, and a given pressure occurs at a higher true altitude than otherwise.
This effect can be moderately large. During the Antarctic night ground temperatures are commonly -50° C (-58° F); with even lower temperatures seen every winter at interior stations. These temperatures are roughly 10-15% closer to absolute zero than are the moderate temperatures experienced elsewhere and at other times. The absolute temperature, being reduced by some 10-15%, results in observing the same pressure at a given elevation, as occurs at elevations 10-15% greater under moderate temperatures. Equivalently, for a given elevation, the pressure altitude will be 10-15% higher under antarctic conditions than for normal temperatures.
At the high temperature end of the climate spectrum the effect is smaller because, relative to moderate temperatures, Earth's hottest surface temperatures deviate by a smaller fraction than do Earth's lowest temperatures, all fractions calculated using the absolute zero of temperature.
Consider the effect of latitude upon pressure altitude. The acceleration due to gravity g varies with latitude as described below. Then, from Equation (1b) latitude effects pressure altitude via this change in g.
The acceleration due to gravity varies with latitude from two sources. One is the centrifugal pseudo-force owing to Earth's rotation, and amounts to a 0.34% decline in g as one travels from either pole to the equator.
Earth's departure from a perfect sphere is the second source of variability, with the polar radius less than the equatorial radius by 1 part in 298 - some 21 kilometers (13 miles). This accounts for an additional fractional decline in g on proceeding from pole to equator.
The sum of these two effects is a small 0.53% rise in g on proceeding from the equator to either pole. As shown later by example, this shift in g effects pressure altitude in a minor fashion that can be neglected for mountaineering purposes.
In Equation (1), pressure at true altitude z, as p(z), varies with both the sea level temperature T(0) and pressure p(0). As it stands, this is sufficient to compute pressure altitude to any reasonable degree of accuracy, within the climbing arena, provided that the instantaneous values of T(0) and p(0) are known. To render our formulation useful, we thus require a means of specifying the statistical variations in both T(0) and p(0) due to changes in weather.
We employ a utilitarian approach that entails analysis of weather records from stations situated near major mountains. Such an approach, although not based on first principles, guarantees an accurate portrayal of pressure variations because it is based on observation rather than a necessarily approximate theory.
Our method consists of the following steps:
The original article describes these steps in detail.
Mount McKinley is the most northerly of the world's big mountains. It is North America's highest summit at 6,194 meters (20,320 feet) above sea level, located in central Alaska at roughly the 63rd parallel.
We evaluate the effects of low temperature, high latitude, and variations in both temperature and sea level barometric pressure, upon pressure altitude at Mount McKinley. These pressure altitudes are compared with pressure altitudes for mountains at more southerly latitudes. For the latter we choose Aconcagua - the highest peak in South America at 6,962 meters (22,841 feet); and, representing the 7,000+ meter peaks of High Asia, Mount Everest.
|
|
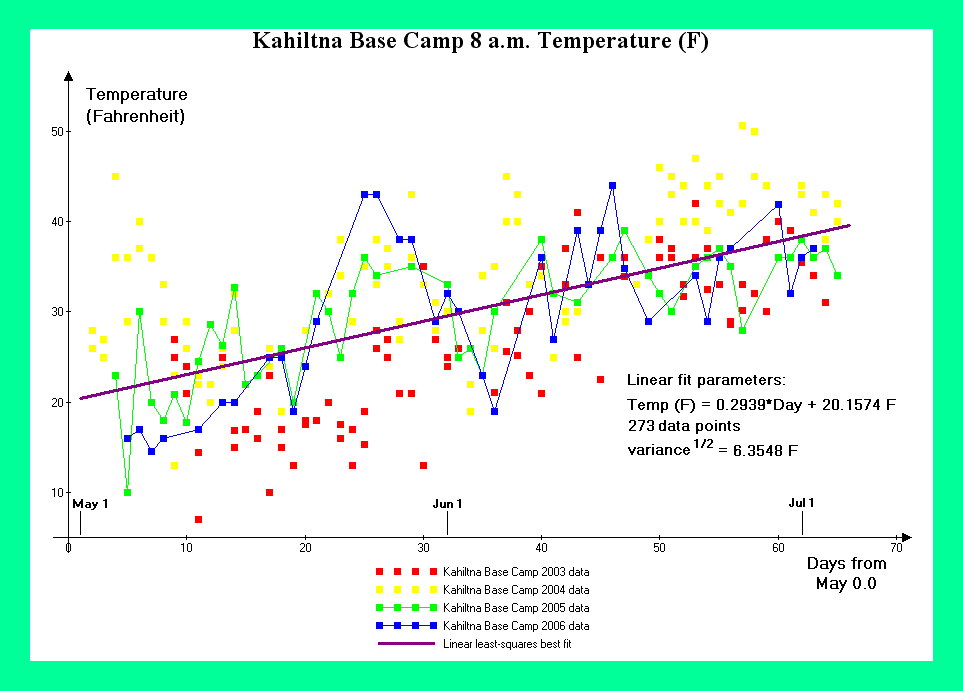
Figure 1. Kahiltna Base Camp temperature data. (Click for a detailed view) |
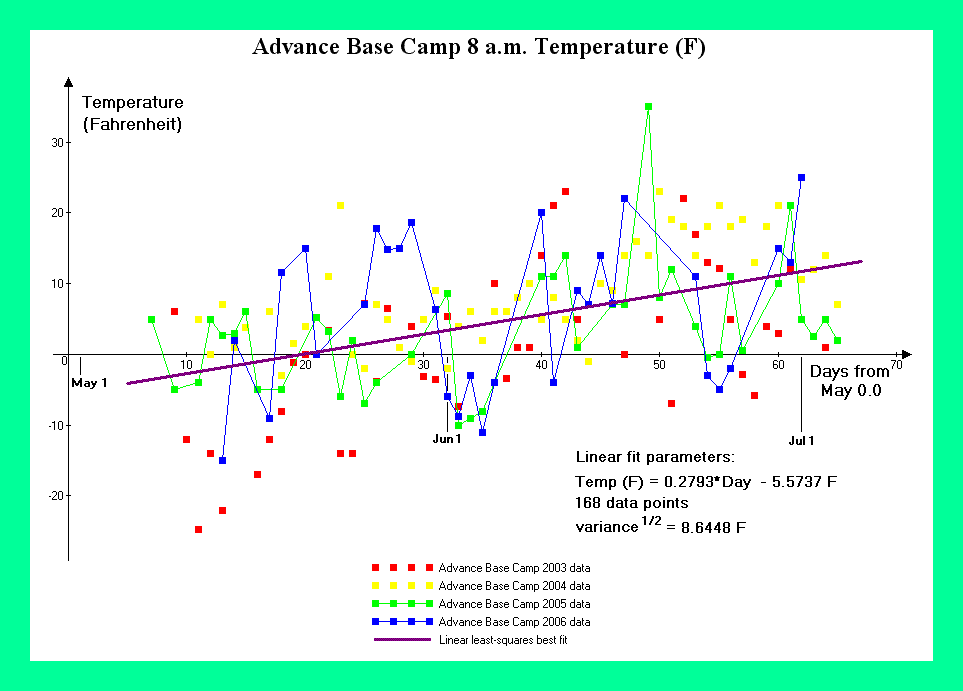
For Mount McKinley meteorological records from the West Buttress Route have been provided by the National Park Service.1 Figure 1 contains temperature graphs from Kahiltna Base Camp at 2,200 meters (7,200 feet) for the 2003 through 2006 climbing seasons. Figure 2 contains temperature graphs from Advance Base Camp at 4,350 meters (14,300 feet) for the same periods.
Using the environmental lapse rate of 6.5° C / km (3.57° F / 1,000 feet), one extrapolates from these observed temperatures to the theoretical, sea level temperatures which would exist at Mount McKinley's base during the climbing season - and as required in the detailed calculations.
Meteorological data from nearby population centers corroborate the estimated sea level temperatures. For Mount McKinley, data is used from both Fairbanks and Talkeetna, Alaska - two communities on opposite sides of the Alaska Range.
|
|
Figure 2. Advance Base Camp temperature data. (Click for a detailed view) |
Temperature and pressure variations contribute to the observed pressure altitude at Mount McKinley and other mountains. Whereas temperature data is available for the West Buttress climbing route, pressure must be estimated based upon meteorological records from the nearby population centers of Fairbanks and Talkeetna, Alaska.
Analysis indicates no trend with day of season for the mean, sea level-corrected pressures at these communities. Mean daily pressure equals that of the Standard Atmosphere to within the current work's desired accuracy - roughly 15 or 30 meters in altitude (50 or 100 feet).
Standard deviations in both mean daily temperature and mean daily pressure are used to compute the overall deviations in pressure altitudes at various camps on Mount McKinley, and for the summit, using equations derived in the original article.
Table 1 presents both the pressure altitudes and their standard deviations for various West Buttress camps and the summit, expressed as pressure altitude minus true altitude differences. The calculations are performed using mean temperatures on five calendar days spanning the May and June climbing season.
Table 1. Mount McKinley pressure altitude / true altitude differences in meters (feet). Variabilities (after the "±" signs) correspond to one standard deviation.a
| May 1 | May 15 | June 1 | June 15 | July 1 | |
| Kahiltna Base Camp 2,200 meters (7,200 feet) |
55 ± 64 (182 ± 211) |
37 ± 64 (120 ± 211) |
14 ± 64 ( 46 ± 210) |
-4 ± 64 (-14 ± 210) |
-25 ± 64 (-81 ± 210) |
| Advance Base Camp 4,350 meters (14,300 feet) |
110 ± 90 ( 362 ± 294) |
73 ± 89 ( 238 ± 293) |
28 ± 89 ( 91 ± 291) |
-8 ± 88 ( -28 ± 289) |
-49 ± 88 (-161 ± 288) |
| West Buttress High Camp 5,250 meters (17,200 feet) |
133 ± 111 ( 435 ± 365) |
87 ± 110 ( 287 ± 362) |
33 ± 110 ( 110 ± 360) |
-10 ± 109 ( -33 ± 357) |
-59 ± 108 (-194 ± 355) |
| Summit 6,194 meters (20,320 feet) |
157 ± 140 ( 514 ± 458) |
103 ± 139 ( 339 ± 455) |
40 ± 137 ( 130 ± 451) |
-12 ± 136 ( -39 ± 448) |
-70 ± 135 (-229 ± 444) |
aTo account for latitude via a shift in g, add these constants to the entries in Table 1: Kahiltna Base Camp 3 meters (11 feet); Advance Base Camp 7 meters (22 feet); West Buttress high camp 8 meters (26 feet); summit 9 meters (31 feet).
Analogous prescriptions for computing pressure altitude are applied to other mountains and mountain ranges as described here.
Mendoza, Argentina and Santiago, Chile are two cities that lie on opposite sides of the Andean Cordillera. Hence they comprise an appropriate set for estimating pressure at Aconcagua just as do Fairbanks and Talkeetna, Alaska for Mount McKinley.
Table 2 presents both the pressure altitudes and their standard deviations for various Aconcagua camps and the summit, expressed as pressure altitude minus true altitude differences. The calculations are performed using mean temperatures on five calendar days covering the December through February climbing season, and are based on the Mendoza, Argentina and Santiago, Chile datasets.
Table 2. Aconcagua pressure altitude / true altitude differences in meters (feet). Variabilities (after the "±" signs) correspond to one standard deviation.a
| December 15 | January 1 | January 15 | February 1 | February 15 | |
| Puente del Inca roadhead 2,750 meters (9,000 feet) |
-98 ± 22 (-322 ± 72) |
-107 ± 22 (-351 ± 72) |
-108 ± 22 (-354 ± 72) |
-102 ± 22 (-334 ± 72) |
-91 ± 22 (-298 ± 72) |
| Ruta Normal Base Camp 4,350 meters (14,300 feet) |
-156 ± 31 (-513 ± 101) |
-171 ± 31 (-562 ± 100) |
-174 ± 31 (-572 ± 100) |
-166 ± 31 (-545 ± 100) |
-150 ± 31 (-493 ± 100) |
| Nido de Condores 5,500 meters (18,000 feet) |
-197 ± 38 (-647 ± 126) |
-216 ± 38 (-710 ± 125) |
-221 ± 38 (-723 ± 125) |
-211 ± 38 (-693 ± 125) |
-192 ± 38 (-629 ± 126) |
| Camp Berlin 5,950 meters (19,450 feet) |
-213 ± 42 (-699 ± 136) |
-234 ± 41 (-768 ± 136) |
-239 ± 41 (-783 ± 136) |
-229 ± 41 (-750 ± 136) |
-208 ± 42 (-682 ± 136) |
| Summit 6,962 meters (22,841 feet) |
-250 ± 49 (-821 ± 162) |
-275 ± 49 (-903 ± 161) |
-281 ± 49 (-922 ± 161) |
-270 ± 49 (-885 ± 161) |
-246 ± 49 (-806 ± 162) |
aTo account for latitude via a shift in g, add these constants to the entries in Table 2: Puente del Inca -3 meters (-10 feet); Ruta Normal Base Camp -5 meters (-16 feet); Nido de Condores -6 meters (-21 feet); Camp Berlin -7 meters (-22 feet); summit -8 meters (-26 feet).
Kathmandu, Nepal meteorological data is used for estimating pressure altitudes at Mount Everest - the mountain chosen as representative of High Asia. It was desired to balance these records with analogous data from Tibet. Unfortunately daily meteorological observations are not readily available for this region.
Table 3 presents both the pressure altitudes and their standard deviations for various Mount Everest camps and the summit, expressed as pressure altitude minus true altitude differences. The calculations are performed using mean temperatures on five calendar days spanning the April and May climbing season, and are based on the Kathmandu, Nepal data.
Table 3. High Asia pressure altitude / true altitude differences in meters (feet) as represented by Mount Everest. Variabilities (after the "±" signs) correspond to one standard deviation.a
| April 1 | April 15 | May 1 | May 15 | June 1 | |
| Lukla, Nepal 2,850 meters (9,380 feet) |
-116 ± 27 (-380 ± 87) |
-135 ± 27 (-444 ± 87) |
-157 ± 26 (-516 ± 87) |
-177 ± 26 (-580 ± 87) |
-200 ± 26 (-656 ± 87) |
| Base Camp (Nepalese side) 5,350 meters (17,600 feet) |
-233 ± 42 ( -765 ± 138) |
-260 ± 42 ( -854 ± 138) |
-291 ± 42 ( -956 ± 137) |
-318 ± 42 (-1044 ± 137) |
-351 ± 42 (-1151 ± 136) |
Advance Base Camp (Tibetan side) 6,500 meters (21,300 feet) |
-286 ± 50 ( -939 ± 166) |
-317 ± 50 (-1039 ± 165) |
-352 ± 50 (-1154 ± 165) |
-382 ± 50 (-1253 ± 164) |
-419 ± 50 (-1374 ± 163) |
| South Col 7,925 meters (26,000 feet) |
-353 ± 62 (-1159 ± 202) |
-388 ± 61 (-1274 ± 202) |
-428 ± 61 (-1405 ± 201) |
-463 ± 61 (-1519 ± 200) |
-505 ± 61 (-1657 ± 200) |
| Summit 8,848 meters (29,028 feet) |
-397 ± 69 (-1301 ± 226) |
-434 ± 69 (-1425 ± 226) |
-478 ± 69 (-1567 ± 225) |
-515 ± 68 (-1690 ± 224) |
-560 ± 68 (-1839 ± 223) |
aTo account for latitude via a shift in g, add these constants to the entries in Table 2: Lukla -4 meters (-14 feet); Base Camp (Nepal) -8 meters (-27 feet); Advance Base Camp (Tibet) -10 meters (-32 feet); South Col -12 meters (-40 feet); summit -13 meters (-44 feet).
In Table 1 baseline pressure altitudes, i.e. without considering their variabilities, are both higher and lower than the true altitudes for Mount McKinley. However in Tables 2 and 3 baseline pressure altitudes are always lower for both Aconcagua and High Asia (the latter represented by Mount Everest). This point is discussed at length in the next section.
It is instructive to directly compare the true altitudes on pairs of mountains for which the pressure altitudes are identical. This exercise is of inherent interest to high altitude climbers and expeditions. We render it practical within this article by limiting consideration to one true altitude: the summit of Mount McKinley.
In Table 4 differences in true altitudes required to match Mount McKinley's summit pressure altitude are presented for Aconcagua as the comparison mountain.
Table 4. Mount McKinley / Aconcagua true altitude differences in meters (feet) for matching pressures at the summit of Mount McKinley. Rows are calendar days during the Mount McKinley climbing season; and columns similarly for Aconcagua. Variabilities (after the "±" signs) correspond to one standard deviation.a
| December 15 | January 1 | January 15 | February 1 | February 15 | |
| May 1 | 393 ± 147 (1291 ± 483) |
418 ± 147 (1371 ± 483) |
423 ± 147 (1389 ± 483) |
412 ± 147 (1353 ± 483) |
388 ± 147 (1274 ± 483) |
| May 15 | 338 ± 146 (1109 ± 479) |
362 ± 146 (1189 ± 479) |
368 ± 146 (1207 ± 479) |
357 ± 146 (1170 ± 479) |
333 ± 146 (1093 ± 479) |
| June 1 | 272 ± 145 (892 ± 475) |
296 ± 145 (971 ± 475) |
301 ± 145 (989 ± 475) |
290 ± 145 (953 ± 475) |
267 ± 145 (876 ± 475) |
| June 15 | 219 ± 144 (717 ± 472) |
242 ± 144 (795 ± 472) |
248 ± 144 (813 ± 472) |
237 ± 144 (777 ± 472) |
214 ± 144 (700 ± 471) |
| July 1 | 159 ± 143 (521 ± 468) |
182 ± 143 (598 ± 468) |
187 ± 143 (615 ± 468) |
177 ± 143 (579 ± 468) |
154 ± 143 (504 ± 468) |
aTo account for latitude via a shift in g, add 17 meters (55 feet) to all tabulated values.
In Table 5 differences in true altitudes required to match Mount McKinley's summit pressure altitude are presented for High Asia, using Mount Everest as the comparison mountain.
Table 5. Mount McKinley / High Asia true altitude differences in meters (feet) for matching pressures at the summit of Mount McKinley. Rows are calendar days during the Mount McKinley climbing season; and columns similarly for High Asia. Variabilities (after the "±" signs) correspond to one standard deviation.a
| April 1 | April 15 | May 1 | May 15 | June 1 | |
| May 1 | 450 ± 149 (1476 ± 489) |
483 ± 149 (1583 ± 489) |
520 ± 149 (1706 ± 489) |
553 ± 149 (1814 ± 489) |
593 ± 149 (1946 ± 489) |
| May 15 | 394 ± 148 (1292 ± 485) |
426 ± 148 (1399 ± 485) |
464 ± 148 (1521 ± 485) |
496 ± 148 (1628 ± 486) |
536 ± 148 (1759 ± 486) |
| June 1 | 327 ± 147 (1073 ± 481) |
359 ± 147 (1179 ± 481) |
396 ± 147 (1301 ± 481) |
429 ± 147 (1407 ± 481) |
468 ± 147 (1537 ± 481) |
| June 15 | 273 ± 145 ( 896 ± 477) |
305 ± 146 (1001 ± 477) |
342 ± 146 (1122 ± 478) |
374 ± 146 (1228 ± 478) |
414 ± 146 (1357 ± 478) |
| July 1 | 212 ± 144 ( 697 ± 473) |
244 ± 144 ( 802 ± 473) |
281 ± 144 ( 922 ± 474) |
313 ± 144 (1027 ± 474) |
352 ± 144 (1156 ± 474) |
aTo account for latitude via a shift in g, add 19 meters (63 feet) to all tabulated values.
The entries in Tables 4 and 5 are not simply the difference of the corresponding, relevant entries in Tables 1 through 3. Specifically, Tables 2 and 3 pertain to specific true altitudes on the comparison mountains, corresponding to established camps - and these camps are not located at the exact pressure altitudes for Mount McKinley's summit.
The magnitudes and seasonal trends in true altitude differences of Tables 4 and 5 are important results discussed below.
Pressure altitude is computed for various true altitudes on Mount McKinley, with analogous results obtained at Aconcagua and High Asia for comparison. The calculations are performed with account of variability in temperature and sea level-corrected barometric pressure.
During the May and June climbing season, Mount McKinley's summit pressure altitude declines from a mean value of 157 meters (514 feet) higher than the true altitude, to 70 meters (229 feet) lower than the true altitude (Table 1). This seasonal trend results from rising sea level temperatures as extrapolated from the detailed meteorological data. Daily temperature variations modify these values with a standard deviation of roughly 140 meters (450 feet). These pressure altitude / true altitude differences are not particularly large compared with the true altitude of 6,194 meters (20,320 feet).
The summit pressure altitude atop Mount McKinley is on average 115 meters (378 feet) lower June 15 compared to May 15. The average summit pressure altitude is 227 meters (743 feet) lower July 1 compared to May 1. Swings in pressure altitude owing to regional weather patterns (mainly via temperature shifts) will cause variability about these mean values.
These observations should be noted by all those contemplating an ascent of Mount McKinley.
During the December through February climbing season, Aconcagua's summit pressure altitude declines from a mean value of 250 meters (821 feet) lower than the true altitude; to a mean value mid-season of 289 meters (922 feet) lower than the true altitude; and then rises to a mean value of 246 meters (806 feet) lower than the true altitude (Table 2). This trend results from rising and then diminishing sea level temperatures as extrapolated from the detailed meteorological data. Daily temperature variations modify these values with a standard deviation of roughly 50 meters (160 feet). These pressure altitude / true altitude differences are not particularly large compared with the true altitude of 6,962 meters (22,841 feet) - but are larger in magnitude than the corresponding differences at Mount McKinley.
During the April and May climbing season, Mount Everest's summit pressure altitude declines from a mean value of 397 meters (1,301 feet) lower than the true altitude; to 560 meters (1,839 feet) lower than the true altitude (Table 3). This seasonal trend results from rising sea level temperatures, and declining sea level-corrected pressures. Daily temperature variations modify these values with a standard deviation of roughly 70 meters (225 feet). These pressure altitude / true altitude differences, although not particularly large compared with the true altitude of 8,848 meters (29,028 feet), are larger in magnitude than the corresponding differences at Mount McKinley and Aconcagua.
It is extremely noteworthy that all pressure altitudes at Aconcagua and Mount Everest, during their respective climbing seasons, are lower than the true altitude (Tables 2,3). In contrast, pressure altitudes at Mount McKinley are at first slightly higher than the true altitude; and then, at season's end, slightly lower than the true altitude (Table 1).
Most mountains are climbed during the warmer months of their respective hemispheres. Hence is it anticipated, and observed, that pressure altitudes will tend to be lower than true altitudes because during these months temperatures are higher than the Standard Atmosphere. The higher temperatures expand the air column and hence diminish the perceived pressure altitude.
Mount McKinley, lying so far north, forms an exception in that even during its optimal season temperatures are tolerably similar to the Standard Atmosphere. Thus pressure altitudes are either marginally higher (May) or lower (late June) than the corresponding true altitudes.
In Table 4 direct comparison is made of true elevations at which the same pressure altitudes are observable on Mount McKinley and Aconcagua. The central entry of that table represents the middle of their respective climbing seasons. Using that entry, one must be an average of 301 meters (989 feet) higher on Aconcagua to observe the same pressure as at the summit of Mount McKinley - 6,495 meters (21,309 feet). Earlier days in the Mount McKinley climbing season, such as May 1, result in larger true altitude differences approaching 400 meters (1,300 feet).
In Table 5 direct comparison is made of true elevations at which the same pressure altitudes are observable on Mount McKinley and, representing High Asia, Mount Everest. The central entry of that table represents the middle of their respective climbing seasons. Using that entry, one must be an average of 396 meters (1,301 feet) higher on Mount Everest to observe the same pressure as at the summit of Mount McKinley - 6,590 meters (21,621 feet). Earlier days in the Mount McKinley climbing season, such as May 1; and/or later days in the Mount Everest climbing season, result in larger true altitude differences approaching 600 meters (1,950 feet).
For both Aconcagua and High Asia, variabilities of these true altitude differences are roughly ± 145 meters (475 feet) at one standard deviation (Tables 4,5).
Noting this variability, from the bottom row of Table 4 it is possible in late June for the pressure altitude at Mount McKinley's summit to be observed on Aconcagua's slopes in December and February at the same 6,194 meter elevation (20,320 feet).
Noting this variability, from the top row of Table 5 it is possible in early May for the pressure altitude at Mount McKinley's summit to be observed at 6,900 meters (22,600 feet) on Mount Everest's slopes in May - 700 meters (2,300 feet) higher than Mount McKinley's summit elevation.
These true altitude differences for matching summit pressure are not due to colder than standard temperatures at Mount McKinley. The differences arise from warmer than standard temperatures at the comparison mountains.
Terris Moore considered the effect of low temperature upon barometric pressure for Earth's highest mountains in a 1968 paper.2 Comparing Mount McKinley summit pressure with the Himalaya, he reports pressure altitudes similar to those calculated here. In the summer Mount McKinley's summit pressure was estimated equivalent to being 400 meters (1,300 feet) higher in the summer Himalaya - 6,600 meters (21,650 feet). This pressure altitude is equivalent to that obtained in Table 5 as the central entry.
In the winter Mount McKinley's summit pressure was estimated equivalent to being a full 950 meters (3,100 feet) higher in the summer Himalaya - 7,150 meters (23,450 feet). This latter value is obtained in the present formulation by using a sea level temperature T(0) = -13° C (8° F) for interior Alaska by winter, and 27° C (80° F) for the comparison Asian mountains.3
Mr. Moore did not provide any formula as basis for his calculation. He did, however, cite Air Force tabulations of barometric pressure in 10° latitude ranges for 0 to 100,000 feet in 10,000 foot increments. He then interpolates to obtain equivalent pressure altitudes.
It is possible that Mr. Moore used a formulation similar to the current one based on Equation (1). However without any mention of how he arrived at his pressure altitudes one can only speculate. If he did not employ any prescription beyond simple interpolation, then the present work both provides a theoretical basis for Mr. Moore's work, and corroborates it through independent calculation.
This temperature-dependence of pressure arises anywhere and anytime - not just on Mount McKinley. Ascending a 14,000 foot mountain in Colorado by winter will meet with a lower atmospheric pressure enroute and at the summit compared with a summer hike. The effect's magnitude is given by the fractional decrease in extrapolated sea level temperature relative to summer.
An extreme example of temperature influencing pressure altitude is given by winter on the Antarctic plateau. Vostok Station has recorded the coldest surface temperatures on Earth. At 3,420 meters (11,220 feet), Vostok has ample elevation and sufficiently low temperatures to support a large pressure altitude / true altitude difference. From roughly April through September the mean daily temperature is typically -65° C (-85° F). The corresponding extrapolated sea level temperture yields a pressure altitude of 4,280 meters (14,035 feet) - fully 860 meters (2,815 feet) higher than the true altitude!
Deviations in mean, sea-level corrected pressures between the various mountains of this article are extremely minor - some three powers of ten less than the pressure itself. These deviations have negligible effects on calculated pressure altitude differences.
Latitude, via a shift in the acceleration due to gravity, causes a change in pressure altitude from a combination of centrifugal force and mass-distribution effects arising from Earth's slightly non-spherical shape.
Account of latitude raises the pressure altitude at Mount McKinley's summit 17 meters (55 feet) relative to Aconcagua (cf footnote Table 4). Account of latitude raises the pressure altitude at Mount McKinley's summit 19 meters (63 feet) relative to Mount Everest (cf footnote Table 5). These changes in pressure altitude are minor, and have little consequence for those climbing the world's higher mountains.
In the climbing literature on Mount McKinley (and apart from Mr. Moore's work), the claim is made that breathing is more arduous for a given altitude because centrifugal force due to Earth's rotation is less than for more temperately located mountains. The atmosphere is "whipped outwards" at the equator, expanding the air column with a resulting higher pressure for a given true altitude.
A centrifugal effect indeed manifests itself by a change in the effective value of g, with g diminished slightly at the equator where the speed of rotation is greatest. g rises only 0.53% between equator and either pole; with 0.34% of this increase due to diminished centrifugal force with latitude. From Equation (1b) all pressure altitudes shift this small fraction as a result of Earth's rotation - roughly one part in 300.
For the summits of two 6,000 meter (19,700 foot) mountains, one at the equator and one at either pole, this fraction corresponds to a 20 meter (66 foot) pressure altitude difference. The pressure altitude correction is normally even smaller still since most mountains are not located exactly on the equator or in the polar regions.
Thus the claim that Earth's rotation is the cause of lower air pressure near the poles is false. Lower air temperature is the overwhelmingly important cause.
The air pressure experienced at a given true altitude is influenced to a modest degree by the extrapolated sea level temperature. Deviations in pressure altitude due to unusually low or high temperatures are sufficiently large as to be of interest to mountaineers.
Most high altitude ascents occur during the warmer months, and, as such, pressure altitude is lower than true altitude. Mount McKinley is an exception - there, temperatures during the climbing season are only marginally colder (May) or warmer (late June) than the standard atmosphere. Hence pressure altitude is tolerably similar to true altitude. Thereby a given pressure on Mount McKinley is observed at higher altitude elsewhere, all mountains being compared during their respective climbing seasons.
High latitude exerts its influence on air pressure indirectly through colder temperatures. Earth's rotation exerts a minor effect on air pressure via altering the effective value of the acceleration due to gravity. The resulting shift in air pressure is minor.
1Meteorological data from near Denali Pass, at 5,600 meters (18,400 feet),
is available from an automated weather station operated by a Japanese Alpine Club /
University of Alaska consortium. It remains to be seen what ridiculously low temperatures
it will record this coming winter of 2006-2007.
2 Moore, Terris, The World's Great Mountains: Not the Height You Think",
American Alpine Journal 109-116 (1968).
3 -13.5° C lies in-between the mean January temperatures
for Talkeetna and Fairbanks, Alaska - two communities on either side of
Denali National Park and Mount McKinley. Extrapolation to sea level and use of Equation (1)
results in the cited equivalent altitude in the summer Himalaya.